rapunzl logo green investing castle
Request Free DemoFree Demo
rapunzl mobile hamburger icon
Rapunzl
Educators
Districts
After-School
Parents
Courses
Investment Simulator
Teacher Portal
Integrated Curriculum
Real-Time Market Data
Certifications
Partners
About Us
Blog
Contact
Simulator Login
Educator Login
Get Free Demo
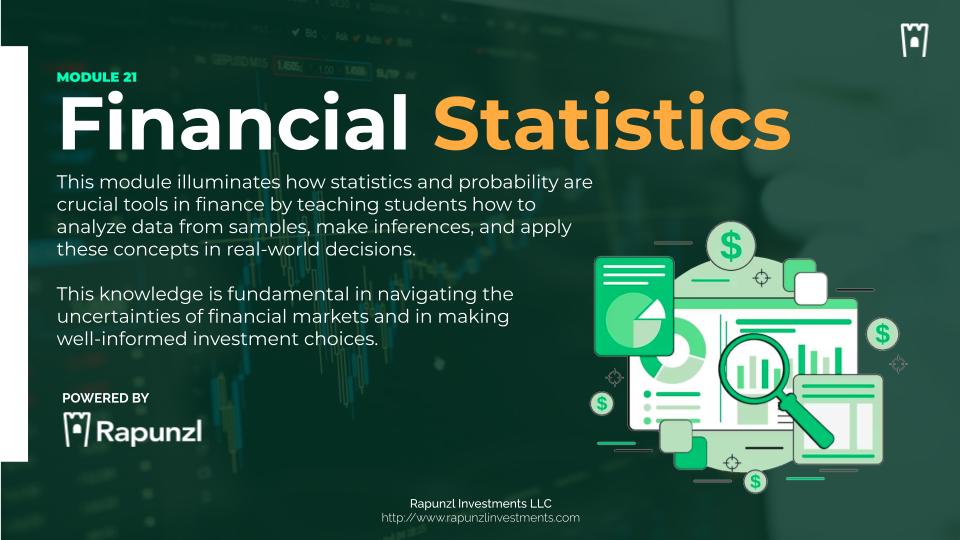
Financial Statistics cover graphic for the Rapunzl personal finance curriculum
Module 21

Financial Statistics

This module illuminates how statistics and probability are crucial tools in finance by teaching students how to analyze data from samples, make inferences, and apply these concepts in real-world decisions.
This knowledge is fundamental in navigating the uncertainties of financial markets and in making well-informed savings and investment choices.

Module At A Glance

Grade Levels:
6th - 12th
Est. Length:
2-5 Hours (17 slides)
Activities:
4 Activities
Articles:
3 Articles
Languages:
English & Spanish
Curriculum Fit:
Math, Business, Economics, CTE, Social Studies
Standards Alignment:
CEE National Standards, Jump$tart National Standards & Relevant State Standards
magnifying glass with stock chart

Guiding Questions

  • How can statistics help us understand a larger population by examining just a sample of it?
  • What makes a sample representative of a population?
  • What limitations and risks can sampling introduce?
  • How do you use data from a random sample to make inferences about a population?
  • What is the difference between correlation and causation?
  • What are scatter plots and how do they help us visualize trends in data?

Enduring Understandings

  • Statistics provide valuable insights into populations by analyzing representative samples, highlighting the importance of sample selection.
  • Random sampling is crucial in statistics as it tends to produce the most representative and unbiased samples, leading to valid generalizations.
  • Inferences about population characteristics can be drawn by examining and interpreting data from random samples.
  • Correlation is not causation, so be sure to think about underlying data when you’re evaluating relationships.

Module Vocab & Key Topics

Statistics
The science of collecting, analyzing, presenting, and interpreting data.
Population
The entire group that is the subject of a statistical study.
Sample
A subset of the population selected for observation and analysis.
Representative Sample
A sample that accurately reflects the characteristics of the population from which it is drawn.
Random Sampling
A method of selecting a sample from a population where each member has an equal chance of being chosen.
Bias
A systematic error in data collection or analysis that leads to incorrect conclusions.
Inference
The process of drawing conclusions about a population based on data collected from a sample.
Correlation
A statistical measure that describes the extent to which two variables change together, but does not imply causation.
Causation
A relationship between two variables where one variable causes a change in another.
Scatter Plot
A type of graph used in statistics to visually display and compare two variables for a set of data.
Trend Line
A line on a scatter plot, drawn to indicate the general course or tendency of the data points.
Sampling Error
The error is caused by observing a sample instead of the whole population, leading to potential inaccuracies in a sample's results.
Confounding Variable
An outside influence that changes the effect of a dependent and independent variable.
Generalization
Extending the results from a sample to a larger population, making assumptions about a whole group based on a sample.


Worked Examples

Statistics In Action

Four questions a statistic has to answer before you trust it — how big the sample was, which average it used, what it left out, and who it asked.

Figures current · August 2026

Sampling error

How 1,000 People Speak For Millions

MoE ≈ 1.96 × (p(1 − p) ÷ n)95% confidence

A survey asks 1,000 randomly chosen adults whether they have a savings account, and half say yes. The sample size sits under a square root, and that is what decides how close to the truth the 50% is likely to be.

±3.1 ptsmargin of error at n = 1,000n = 4,000 → ±1.5

±3.1 pts46.9%mean 50%53.1%

Quadrupling the sample only halves the error, because n sits under a square root — precision gets expensive fast.

Mean vs median

Why The Average Is Misleading

mean − median = skewsame families

In the Federal Reserve's 2022 Survey of Consumer Finances, the median family had a net worth of $192,900. The mean was $1,063,700. Same families, same data, two very different summaries.

5.5×the mean is 5.5 times the medianmedian: $192,900

Median  $192,900Mean  $1,063,700

A handful of very large fortunes pull the mean up until it describes almost nobody — for money, the median is the honest statistic.

Correlation

Two Numbers That Move Together

−1 ≤ r ≤ +1strength, not cause

Imagine plotting a class's streaming subscriptions against their households' credit-card balances. The points climb together and r comes out near 0.93 — and neither one is causing the other.

r ≈ 0.93a very strong correlationcause: neither

1 sub6 subs$0$2,400

Household income moves both numbers, which makes it the confounding variable — a trend line measures how tightly two things travel together, never why.

Bias

The Poll That Got It Backwards

error = sampling error + biasonly one shrinks

In 1936 the Literary Digest mailed 10 million straw ballots, got 2.4 million back, and predicted Landon would beat Roosevelt 57% to 43%. Roosevelt won 46 of the 48 states.

2.4Mresponses, and still wrongGallup: ~50,000, and right

Predicted  Landon 57%  Roosevelt 43%Actual  Landon 36.5%  Roosevelt 60.8%

Sampling error shrinks when you add people; bias does not — the Digest's lists of car and telephone owners were a wealthier America than the one that voted.

Sources: Federal Reserve Survey of Consumer Finances, 2022; the 1936 Literary Digest straw poll and election result. Reviewed August 2026.