rapunzl logo green investing castle
Request Free DemoFree Demo
rapunzl mobile hamburger icon
Rapunzl
Educators
Districts
After-School
Parents
Courses
Investment Simulator
Teacher Portal
Integrated Curriculum
Real-Time Market Data
Certifications
Partners
About Us
Blog
Contact
Simulator Login
Educator Login
Get Free Demo
Diversification & Risk cover graphic for the Rapunzl personal finance curriculum
Module 7

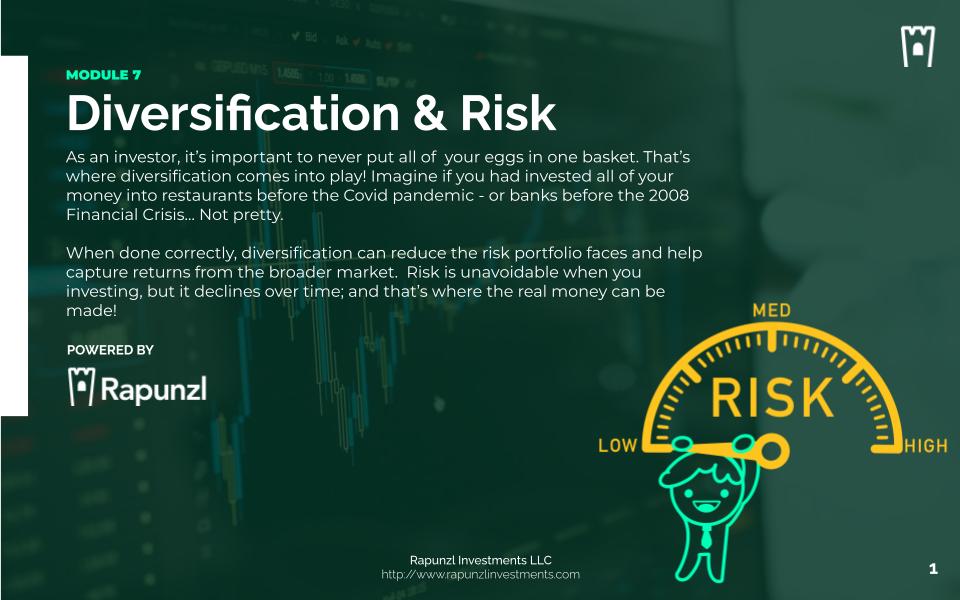
Diversification & Risk

Imagine if you had invested all of your money into restaurants before the Covid pandemic - not pretty. When done correctly, diversification can reduce the risk portfolio faces and help capture returns from the broader market.
Risk is unavoidable when you investing, but it declines over time, and that’s where the real money can be made!

Module At A Glance

Grade Levels:
7th - 12th
Est. Length:
3-5 Hours (18 slides)
Activities:
7 Activities
Articles:
6 Articles
Languages:
English & Spanish
Curriculum Fit:
Math, Business, Economics, CTE, Social Studies
Standards Alignment:
CEE National Standards, Jump$tart National Standards & Relevant State Standards
magnifying glass with stock chart

Guiding Questions

  • What are the different types of risk?
  • How can risk be mitigated through time and/or diversification?
  • What does diversification mean when it comes to investing?
  • What does the acronym FETCH stand for?
  • What does dollar-averaging mean?
  • What other investments are there other than the stock market?
  • How should you allocate your investments?

Enduring Understandings

  • Everyone has a different risk profile that they are comfortable with.
  • It is important to figure out how much risk you personally are comfortable with before investing.
  • Investing in different companies and asset classes can reduce a lot of risks but never eliminate all of them.
  • FETCH stands for Finance, Energy, Technology, Communications, and Healthcare, representing 5 core industries.
  • Deciding on an investment strategy and researching before investing can save you a lot of trouble – and money - in the future.

Module Vocab & Key Topics

Diversification
The process of spreading investments across multiple asset classes and markets to reduce the risk of loss. It helps to reduce the volatility of portfolio returns, as well as the potential for high losses due to over-concentration in any one particular asset class or market.
Risk Tolerance
An individual’s capacity for enduring the fluctuations and losses that accompany investing in different asset classes and markets. Generally speaking, a higher risk tolerance means that an investor is more willing to accept greater risks for greater potential rewards.
Risk/Reward Ratio
A measure of how much reward comes with risk. This ratio of potential return versus risk is an important metric used by investors when determining which investments to make.
Leverage
The ability to control more money in investments than you have in capital; this can increase both profits and losses depending on how it is used and how successful an investment strategy becomes.
Margin Trading
Taking out loans from brokers to fund investments; this increases leverage and can result in greater profits, but also greater losses if markets turn against the investor.
Hedge Funds
Investment funds that use alternative strategies such as leverage, futures, and options to make money from different kinds of investments including commodities trading.
Hedging
Making sure an investment is protected from any negative changes in market movements by using derivative instruments such as futures and options contracts; this helps mitigate risk from investments and reduce losses during times of uncertainty in markets.
Asset Correlation
A measure of how two assets move in relation to each other; if their correlation is high then they will generally move together; if their correlation is low then they will generally move independently or even in opposite directions. Asset correlation plays an important role in portfolio diversification as it allows investors to identify assets that may be uncorrelated or even negatively correlated so as to reduce overall portfolio volatility levels.
Portfolio Allocation
The process of selecting and allocating funds across different asset classes and markets in order to achieve a desired level of diversification and risk/reward ratio. Portfolio allocation can be done manually or with automated tools that take into account your personal goals, preferences, and risk tolerance.
Rebalancing
The process of periodically re-allocating funds from certain assets or markets where performance has been strong back into those where performance has been weak so as to maintain desired levels of diversification and risk/return ratios across an entire portfolio on an ongoing basis.
Modern Portfolio Theory (MPT)
A theory proposed by economist Harry Markowitz that suggests diversifying investments across different asset classes can maximize returns while minimizing associated risks. MPT also postulates that investors can use mathematical formulas to determine optimal portfolios based on expected rates of return, volatility levels, correlation between assets, and other factors.
Futures Contract
An agreement to buy or sell a specified amount of a commodity at a predetermined price on a future date; this contract is typically traded on the commodities market.
Commodity Market
A marketplace where commodities (such as crude oil, gold, or silver) are traded for cash or other commodities.
Basis Trading
Buying and selling different types of commodities based on their differences between spot prices and futures prices; basis traders seek to take advantage of price discrepancies between different contracts on the same underlying asset to make profits without taking ownership of the asset itself.
Options Contracts
Derivative financial instruments that give buyers the right (but not the obligation) to buy or sell an underlying asset at a predetermined price before expiration date; these are typically used by sophisticated investors seeking to maximize profits while mitigating risk exposure over time periods with high volatility such as near expiry dates for futures contracts when prices can change quickly within short periods of time due to news events or shifts in demand/supply dynamics affecting those assets over short-term windows like weeks or days instead of months or years (which is more typical for long-term investing).


Worked Examples

Diversification In Action

Four pictures of why spreading money out lowers risk without lowering the average return.

Figures current · August 2026

Concentration

One Stock Swings Harder

σ single stock > σ indexsame period

The S&P 500's yearly return has historically swung about ±15% around its average — one standard deviation. A single company's stock swings far wider, because it carries every risk unique to that one business. Picture a volatile stock whose returns scatter across a band closer to ±30%, twice as wide.

±30%one stock's yearly swing (±1σ)S&P 500: ±15%

±30% · one stock-30%mean 10%52%

A single stock's returns scatter far wider than a whole index's, because the index averages away each company's own risk.

Combining assets

The Whole Is Calmer Than the Parts

σ blend < w₁σ₁ + w₂σ₂when corr < 1

Imagine two assets that each average about 5% a year and each swing roughly ±12%, but rarely move together — their correlation is about −0.4. A 50/50 blend, shown in gold, keeps the same ~5% average while its year-to-year swing shrinks to about ±7%, because their opposite moves partly cancel.

±7%the blend's yearly swing (±1σ)alone: ±13%, ±12%

Yr 1Yr 8−10%0%+20%Asset AAsset B50/50 blend

Assets that don't move together partly cancel, so the mix is steadier than either one alone while its average return is untouched.

How many stocks

Risk Falls, Then Flattens

diversifiable risk → 0 as N risesN = holdings

A classic result: hold one stock and your risk is that company's own — here about 30% a year. Add more names and the company-specific risk averages away. By twenty or so holdings the portfolio's swing nears 15%, the market's own level, and extra stocks barely lower it, since only market-wide risk is left.

30% → 16%portfolio risk, 1 stock to ~20market floor: ~15%

11020300%15%30%market risk≈20 holdings≈20 holdings

Most of the diversification is captured by the first couple dozen holdings, and what stays behind is the market-wide risk no stock count can remove.

Allocation

Splitting Stocks and Bonds

stock % ≈ 110 − agerule of thumb

One rule of thumb sets your stock percentage at roughly 110 minus your age, with the rest in bonds. At 25 that is about 85% in stocks; at 45, 65%; at 65, 45%. The share falls because a shorter time horizon leaves fewer years to recover from a bad stretch in the market.

85% → 45%stock share, age 25 to 65bonds: 15% → 55%

Age 25  85% stocks  15% bondsAge 45  65% stocks  35% bondsAge 65  45% stocks  55% bonds

A longer horizon can hold more stock risk; a shorter one shifts toward bonds, since the same subtraction moves a point from stocks to bonds each year.

Card 1's ±15% is the S&P 500's long-run annual standard deviation (~15-18% depending on the period; sources reviewed 2026-08-24). The single stock in card 1 and all of cards 2-4 are illustrative — invented assets, the classic risk-vs-holdings curve, and the 110−age rule. Reviewed August 2026.